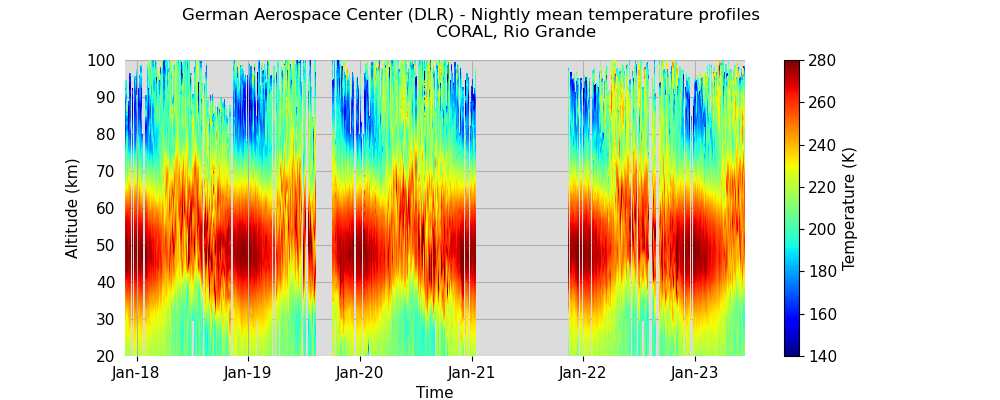

CORAL AMTM TELMA HELIX OP-LIDAR
| MON | TUE | WED | THU | FRI | SAT | SUN |
|---|---|---|---|---|---|---|
| 1 | 2 21:26 (13h39) | 3 | 4 | |||
| 5 | 6 10:43 (10h55) | 7 21:17 (12h33) | 8 21:32 (9h43) | 9 | 10 01:33 (10h30) | 11 21:25 (14h35) |
| 12 23:08 (10h36) | 13 | 14 | 15 | 16 | 17 | 18 |
| 19 | 20 | 21 | 22 | 23 | 24 | 25 |
| 26 | 27 | 28 | 29 | 30 |
Panel (a) emulates the measurement of a vertically staring ground-based lidar. Panel (b) shows absolute temperature profiles (ERA5: black, Lidar: red). Panels (c), (e) and (g) show contours of ERA5 temperature perturbations (T-T21) at different altitudes and the horizontal wind speed at 300hPa color coded in green. Panels (d), (f) and (h) show same contours of temperature perturbations overlaid with the 2PVU level (dynamical tropopause height) color coded. Panels (i) and (j) show vertical cross sections with contours of ERA5 T' and height of the dynamical tropopause for different values (2PVU level in green). Zonal and meridional wind components are overlaid (solid: positive, dashed: negative). The black vertical line in (a) marks the current timestamp for (b)-(j).
Publication archive - Rules of the Road for data usage - Impressum / Imprint - Datenschutzerklärung / Privacy Policy